
Improve your situation awareness before the flight.
See your flight before you push back.
Preflight Lens reads the NOTAMs, the weather, your minima, the maps, the turbulence and the cruise levels for one flight, and shows you what actually matters at your take-off time.
Android & iOS · Information only, always check your official briefing.
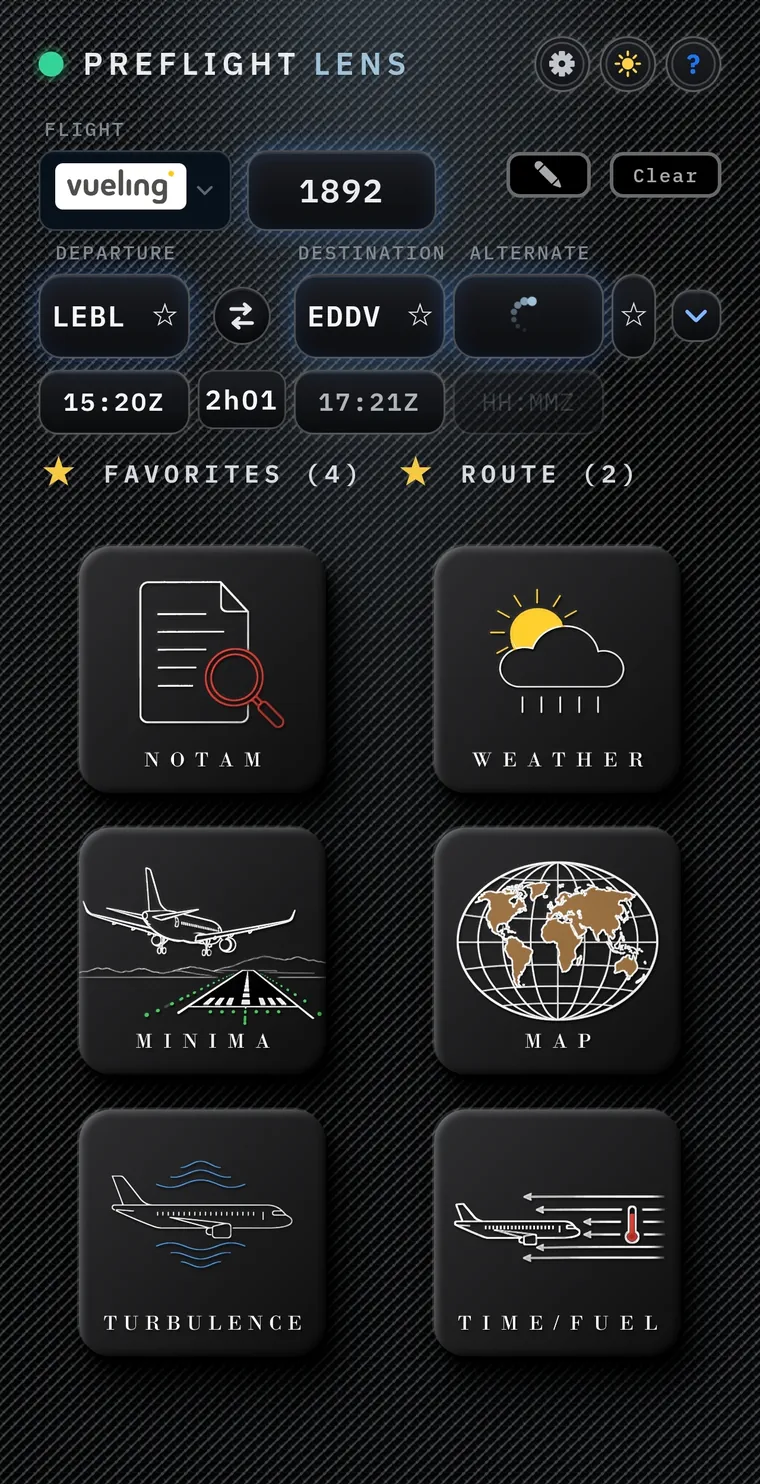
One flight · six lenses
Select your flight from your roster or insert your company and your flight number. The rest fills itself.*
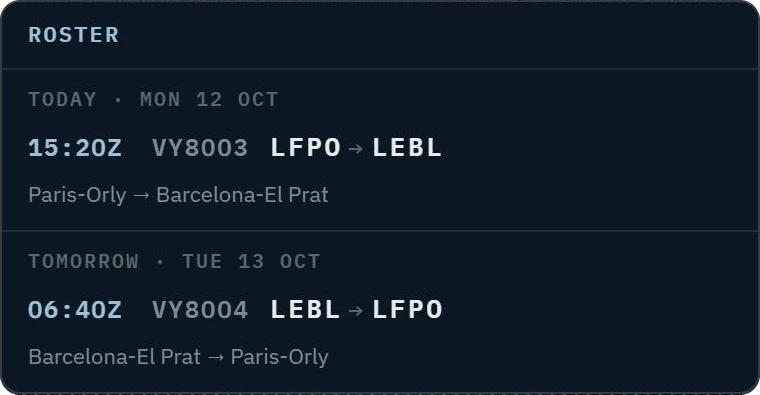
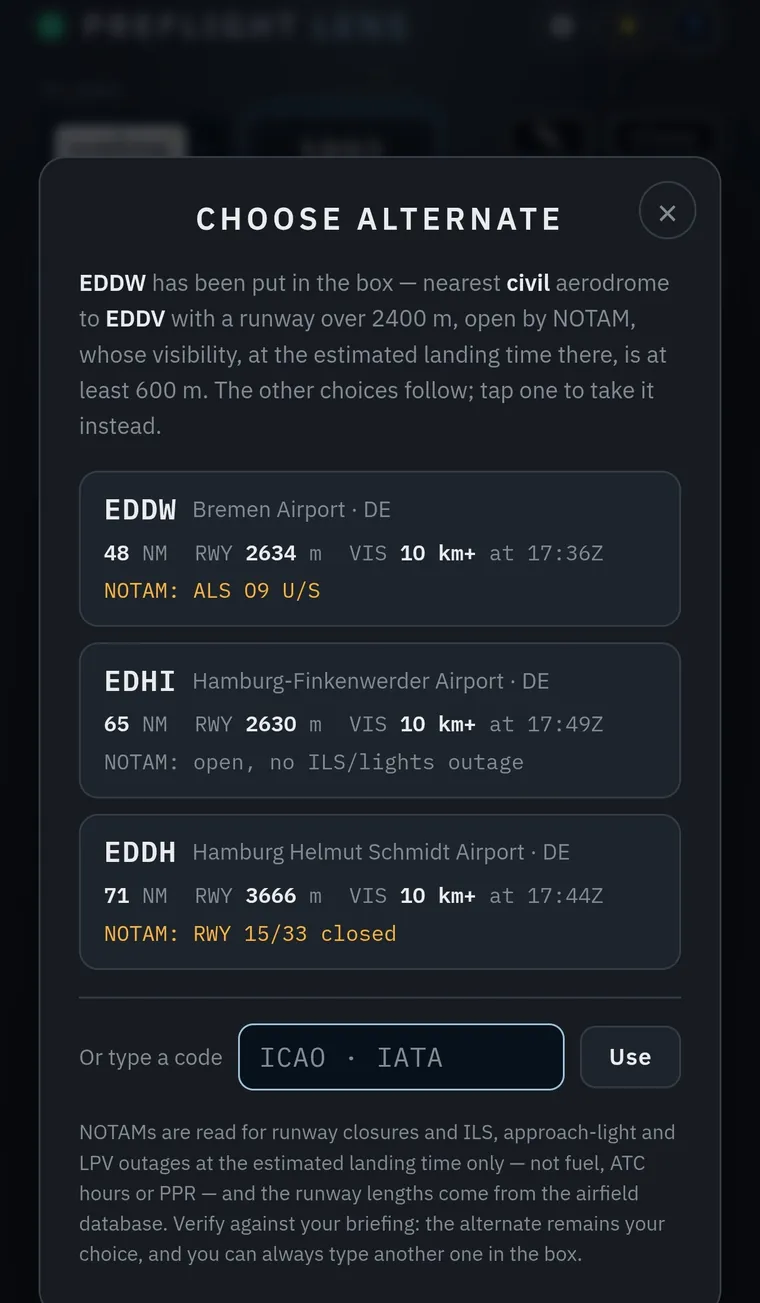
Pick the airline, type the number: departure, destination and the day's schedule come from the airline's own departures. Or tap a leg of your roster: today's and tomorrow's flights are read from your phone calendar or a roster file, on the device only. The alternate is proposed from the nearest civil aerodrome that is open by NOTAM, long enough, and above minima at your landing time. Then open any lens.
-
 01
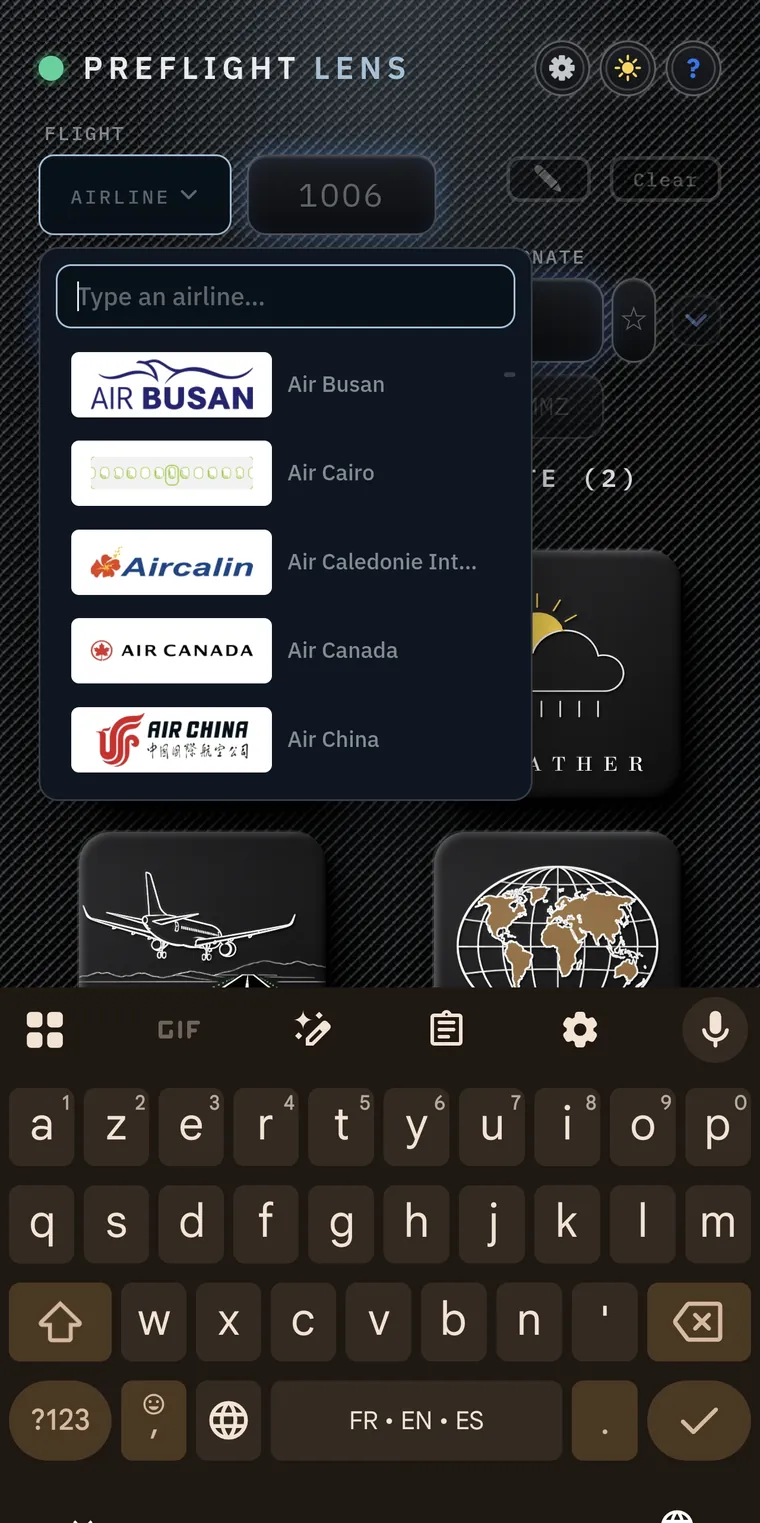
01Airline and number*
Logos, not codes. Type a few letters, pick the airline, enter the number. That is the whole form.
-
 02
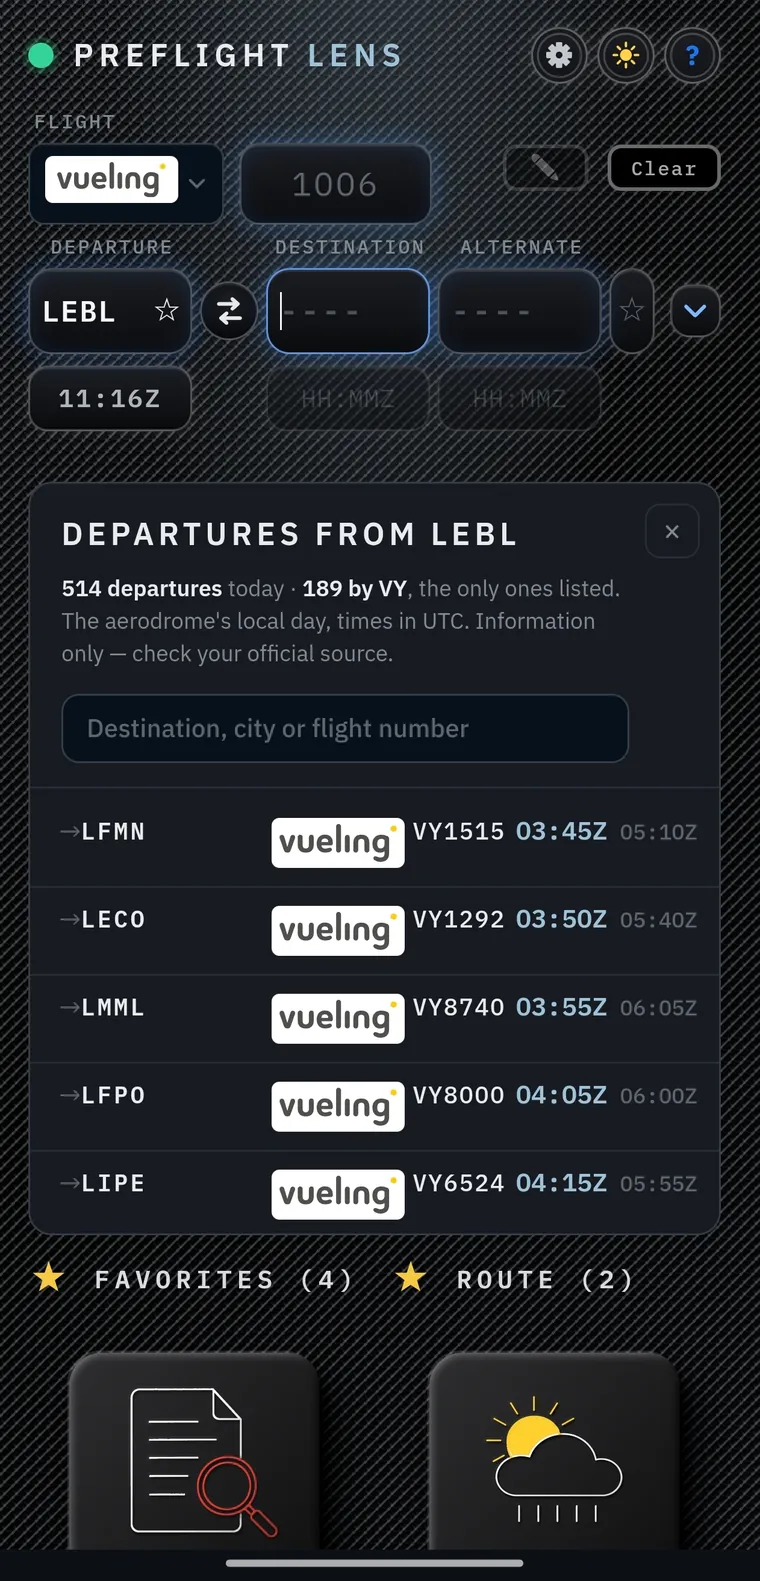
02Today's departures*
514 departures at LEBL, 189 by your airline: the list is filtered to your company, searchable by destination, city or number, in UTC.
-
 03
03Alternate, with the argument
Alternates are suggested based on distance, weather and NOTAMs. Select one or enter your own. The final choice is yours.


NOTAMs, filtered according to your take-off and arrival times.*
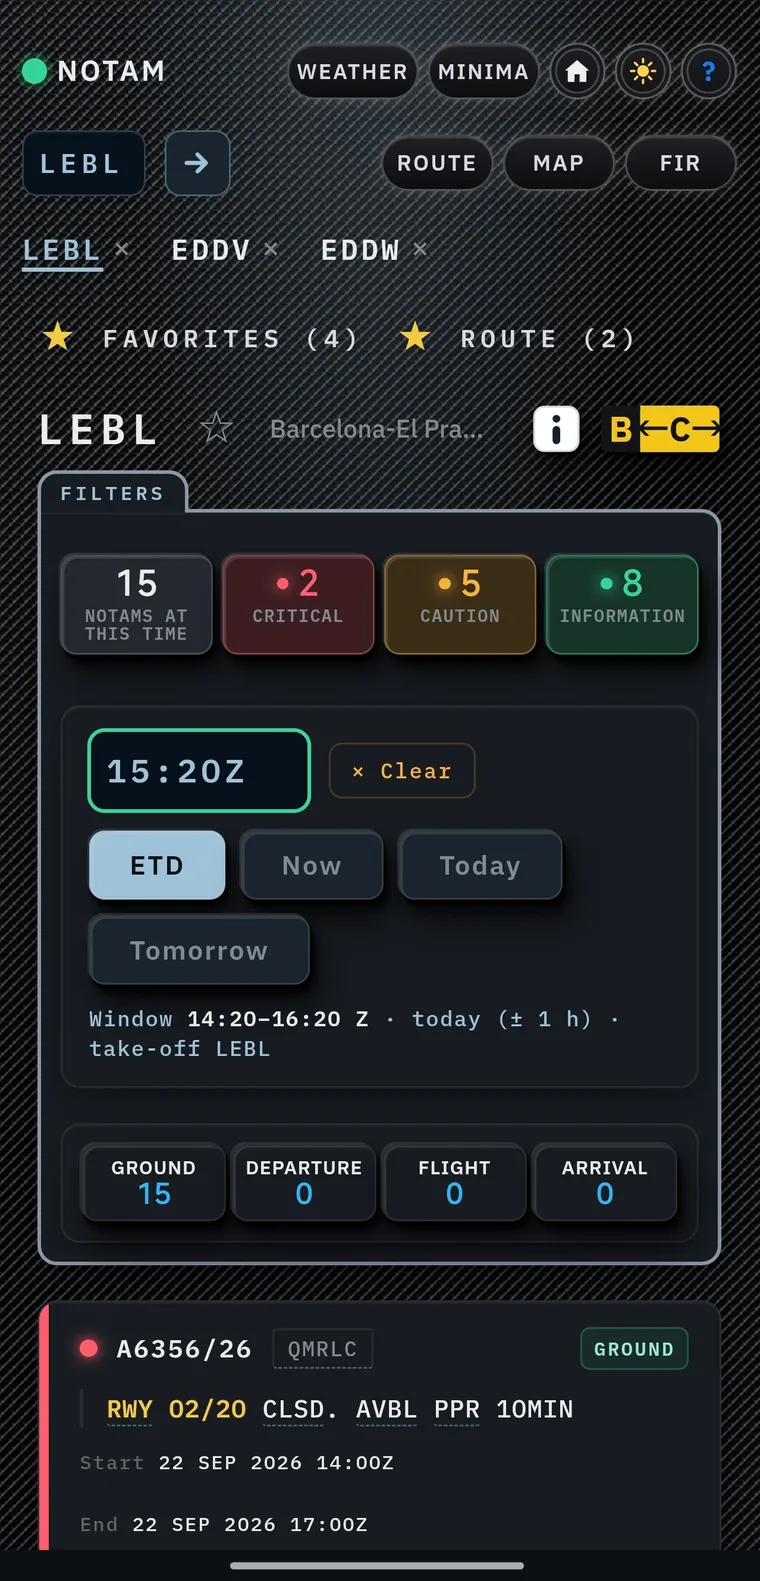
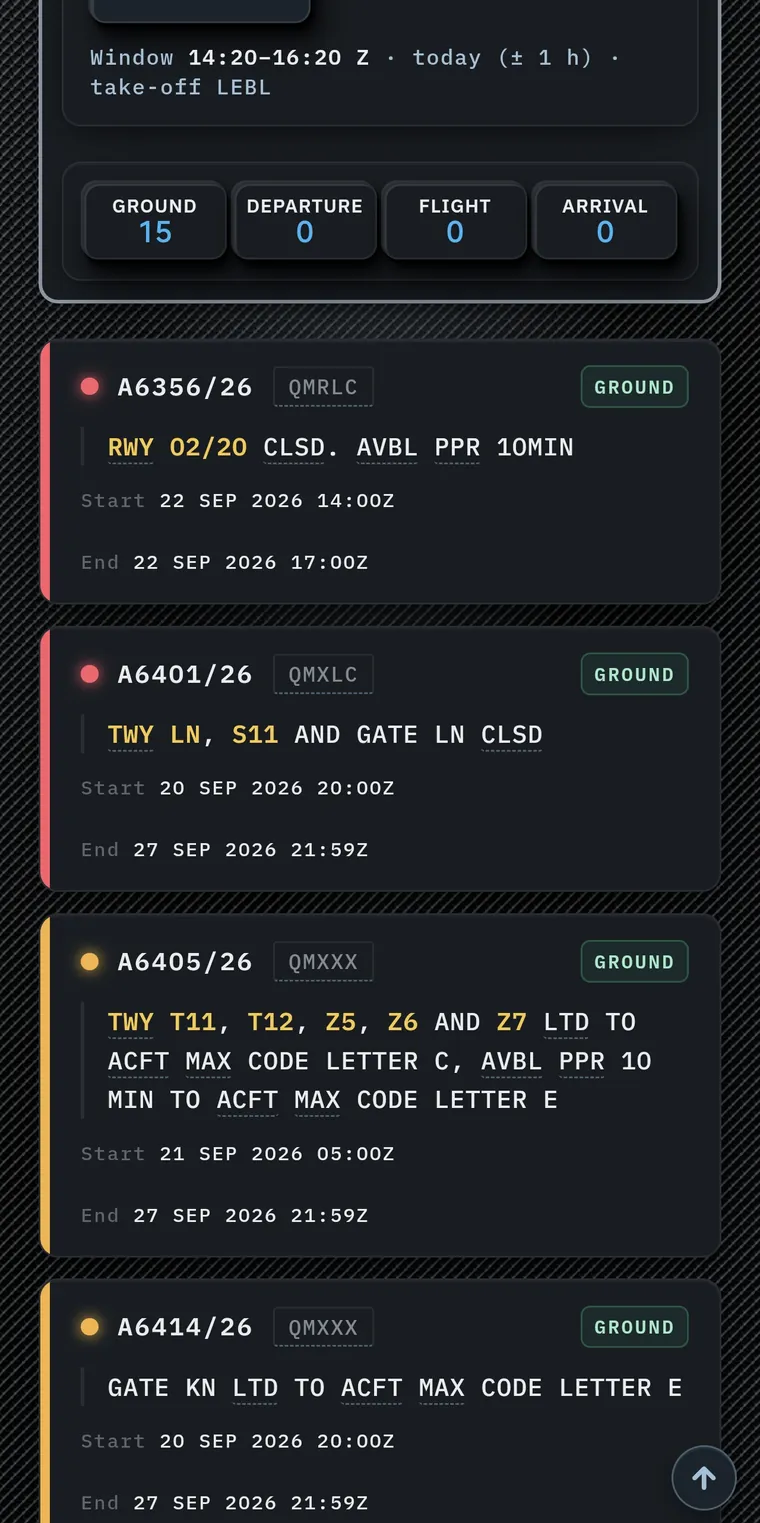
15 NOTAMs at LEBL at 15:20Z, 2 critical. Preflight Lens reads the whole stack, keeps what is active in your window, and colours each one by what it does to your flight.
Colour by consequence
Runway closures and prohibitions in red, degraded aids in amber, the rest in green. A closure that has been lifted reads as reopened, not as a new alarm.
Your window, not the whole week*
The counters follow the time you pick. Change the ETD and the two critical ones may become none.
Placed in the phase it touches
Taxiway limits sit in Ground, airspace in Flight, ILS outages in Arrival.
Readable on tap
Q-codes decoded, abbreviations underlined with their meaning a tap away. The raw text stays, exactly as issued.
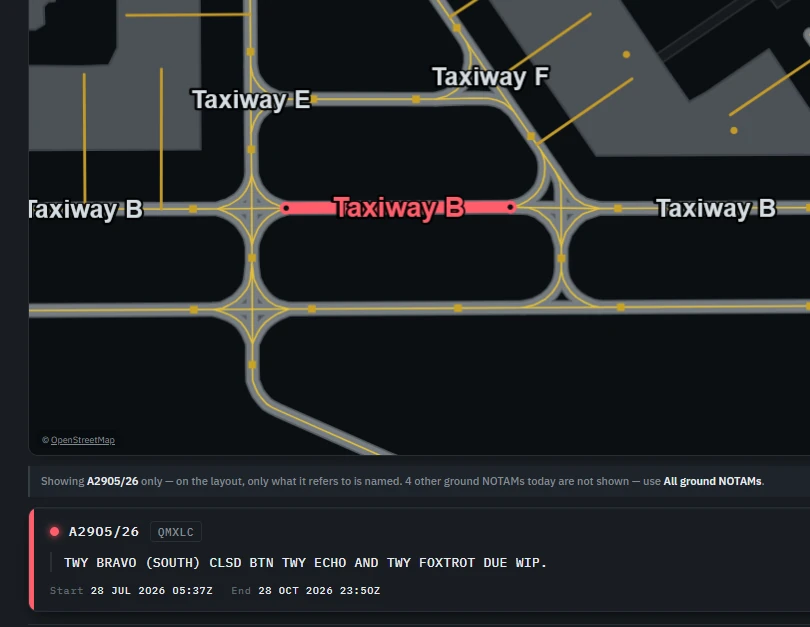
Ground NOTAMs on the layout
A majority of ground NOTAM are identified on a layout of the airport.
FIR NOTAMs
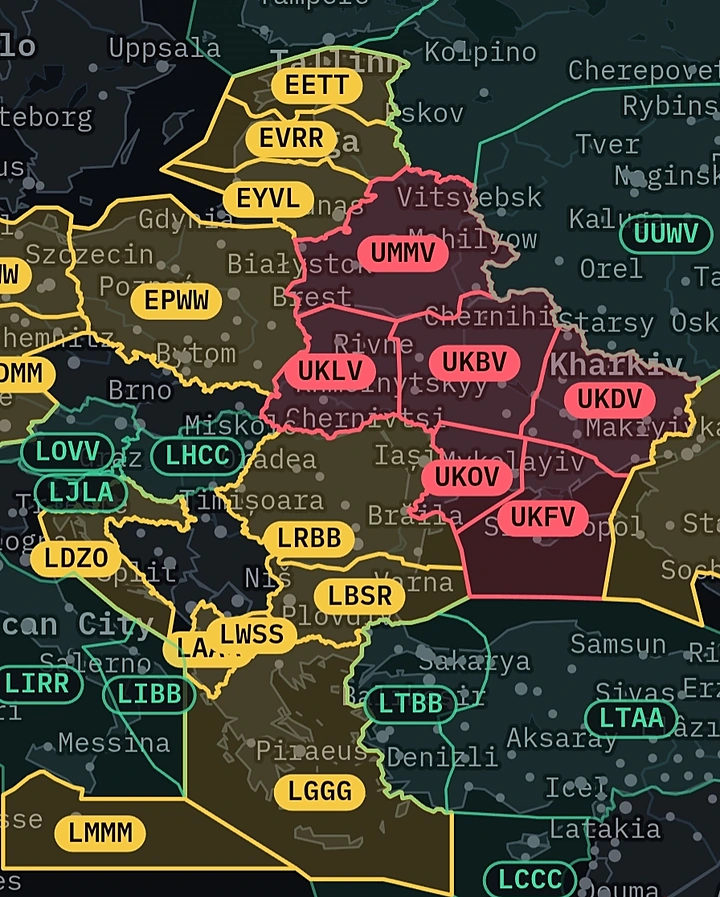
Tap a FIR to see all of its NOTAMs in detail. Restricted FIRs show in amber, closed FIRs in red.

METAR, TAF and estimated runway in use
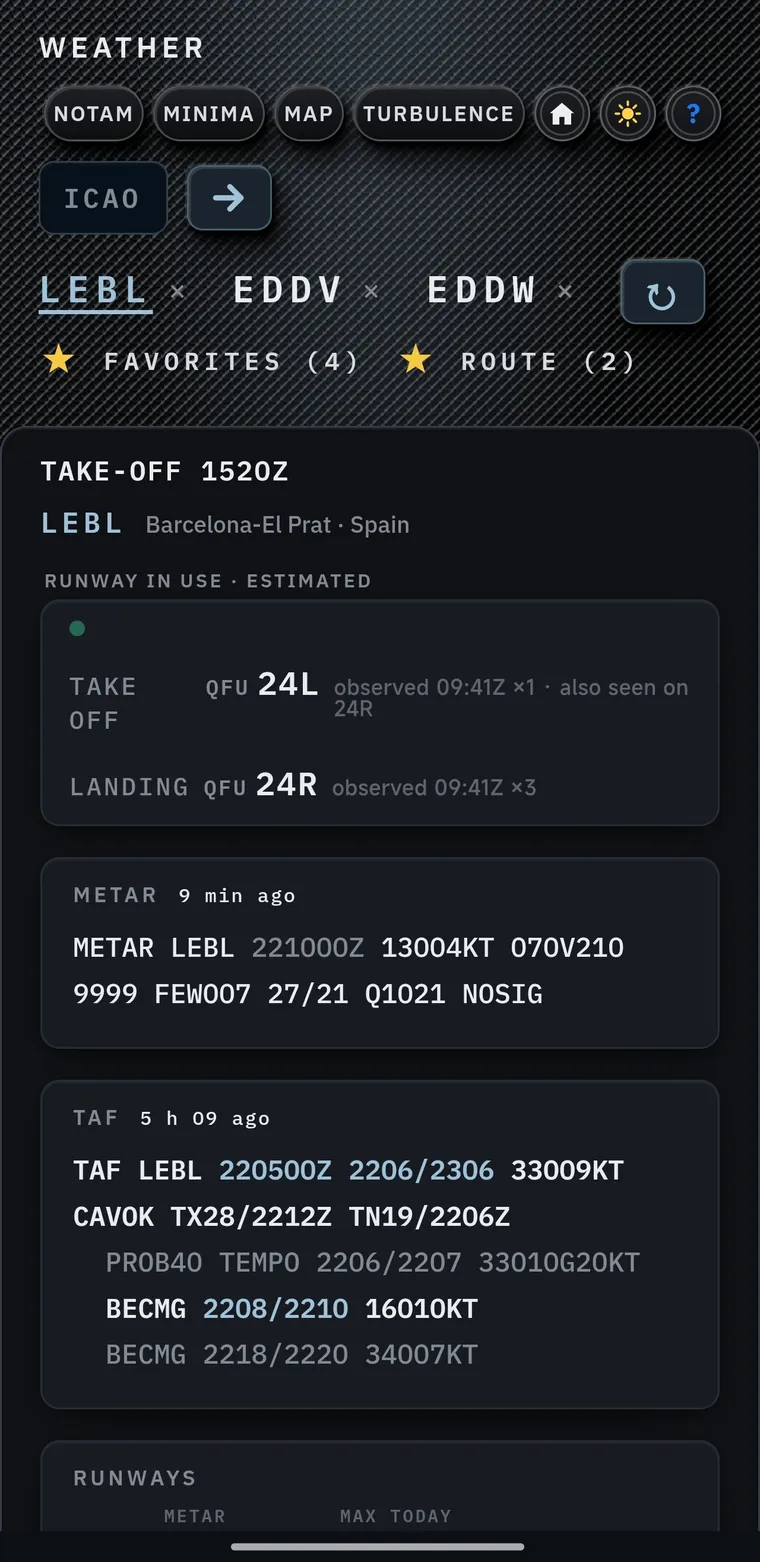
Runway in use, estimated*
Estimated runways in use according to observed traffic, NOTAMs, wind and preferential runways.
METAR and TAF
METARs and TAFs, colour-coded based on your ETA and ETD.*
The five previous METARs are one tap away.
D-ATIS (only for US airports).Wind per runway
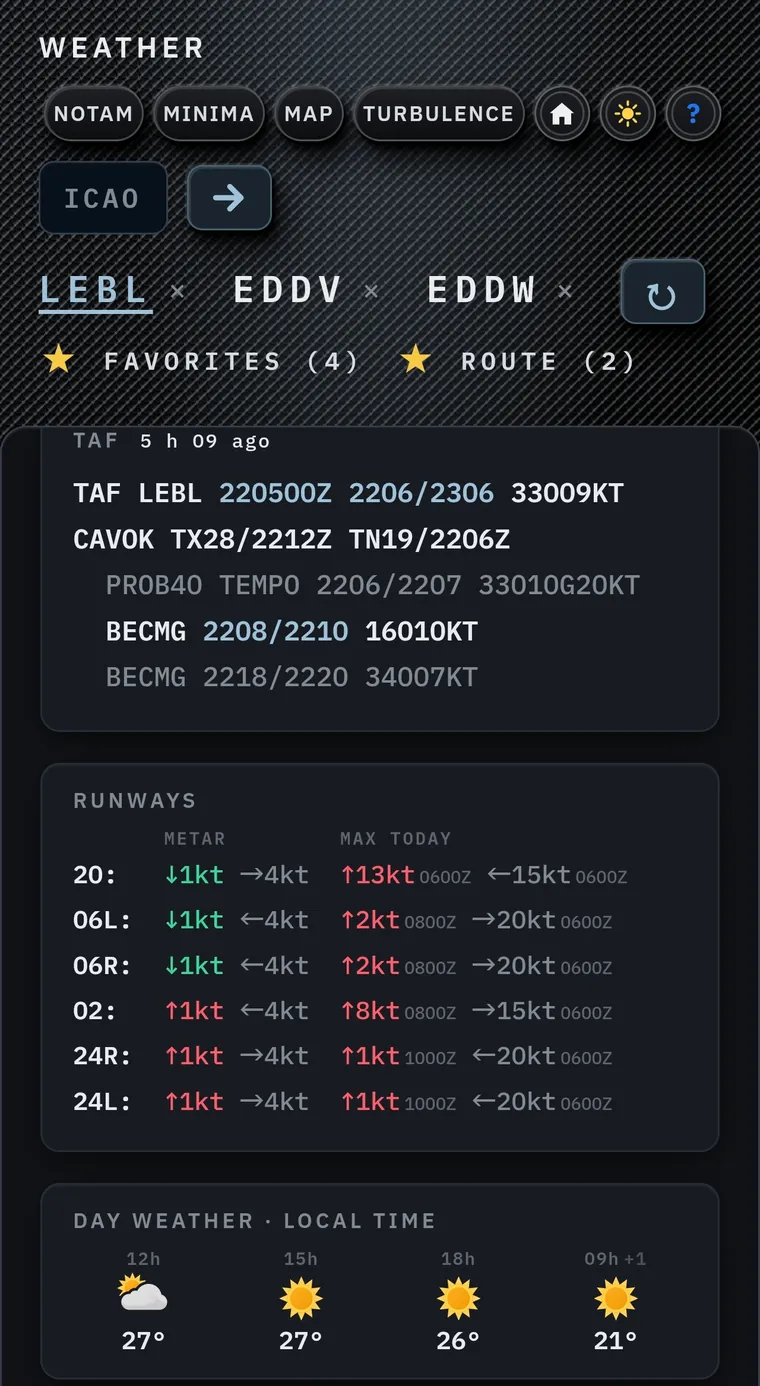
Head or tail component and crosswind for every runway, from the METAR and from the worst hour of the day.
SNOWTAM, decoded*
Runway condition: the code for each third of the runway, the contaminant and its depth, the time of the assessment, with the SNOWTAM as published. US FICON and Canadian RSC too.
Day weather in local time
The picture of the day, temperature and sky to brief your passengers.


A tool to help you make your decision.
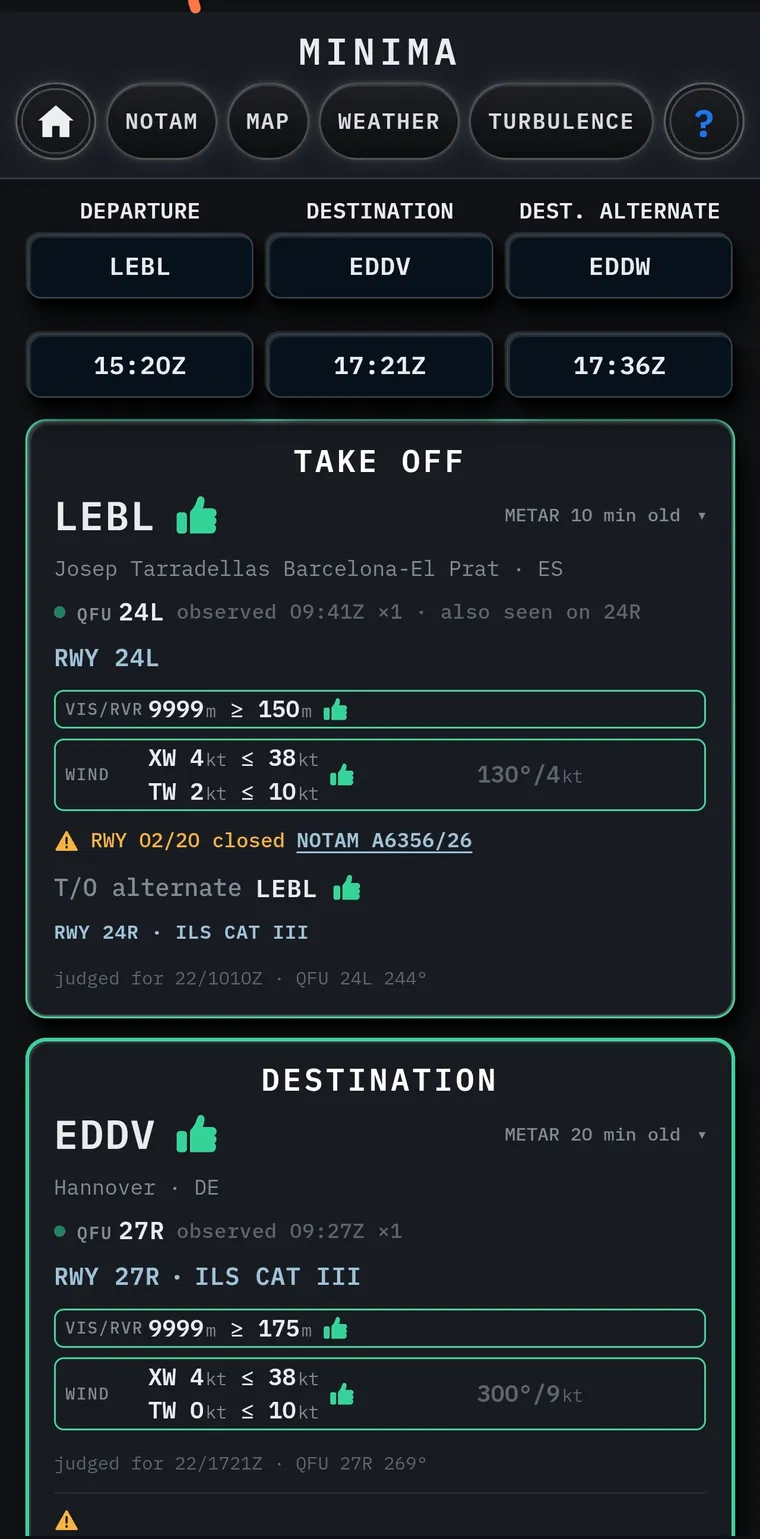
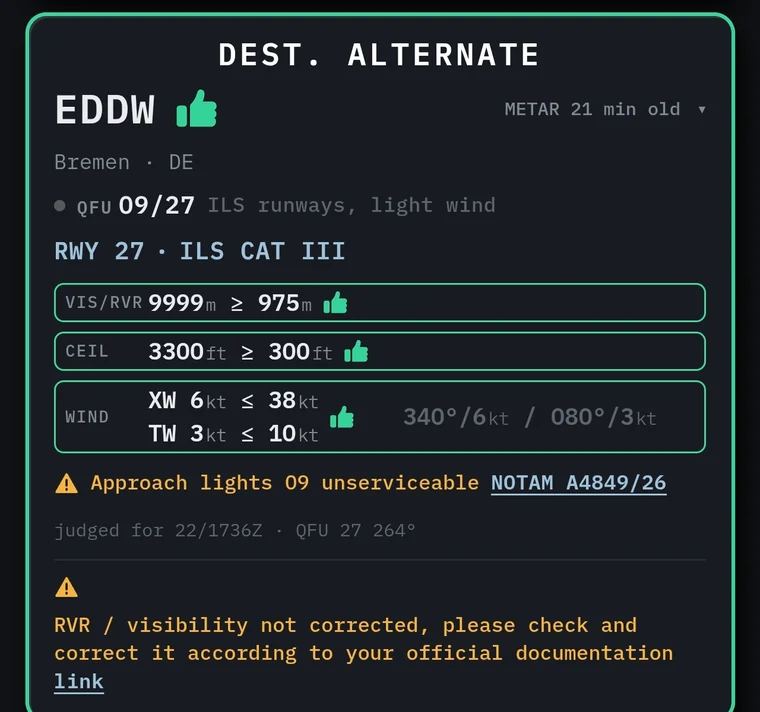
Take-off, destination, destination alternate: each runway is checked against your minima at the estimated time.
Visibility, RVR, ceiling
Runway estimated, NOTAMs in force, RVR/visibility checked against your minima.
Wind limits
Crosswind and tailwind components against your limits.
NOTAMs cross-referenced
RWY 02/20 closed. Approach lights 09 unserviceable. The same stack you triaged, quoted where it changes the answer.
Take-off alternate
Proposed when the departure needs one, judged the same way.

Four layers. One route line.
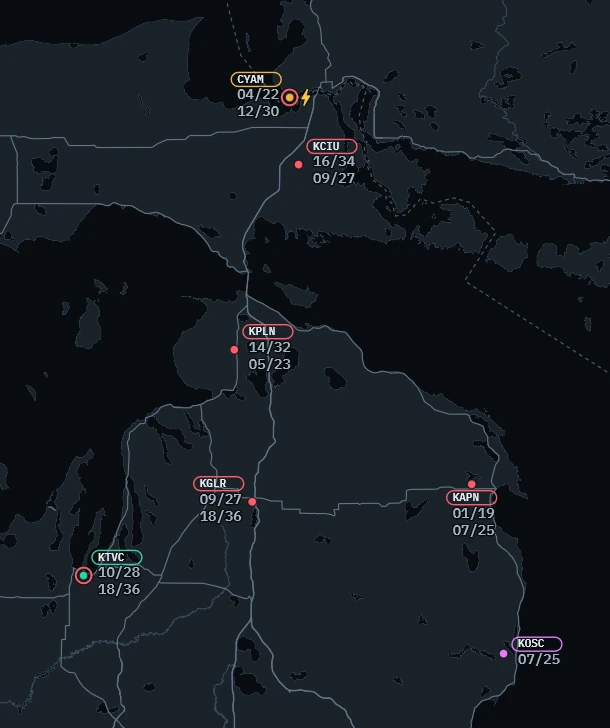
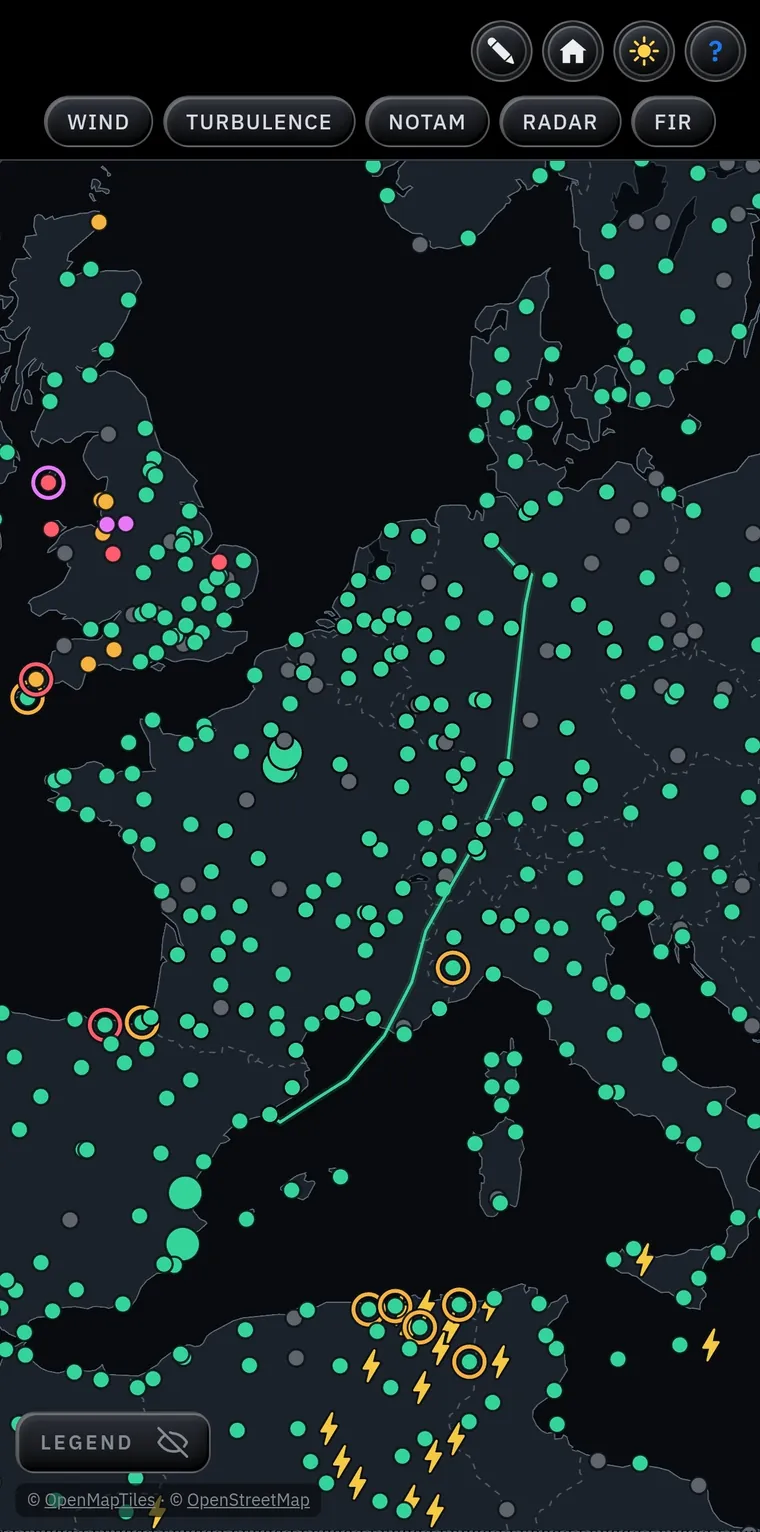
Every aerodrome as a dot coloured by its visibility and ceiling, a ring when the TAF shows a deterioration in visibility and/or ceiling, a bolt for CB. Your route is the track actually flown on this city pair over the last seven days, and the turbulence is read along it.
Current conditions and forecast trends
Green above 2 000 m and 1 000 ft. Amber, red, purple as it closes in. A ring means the TAF is worse than the METAR for the next three hours, or for the hour you selected.
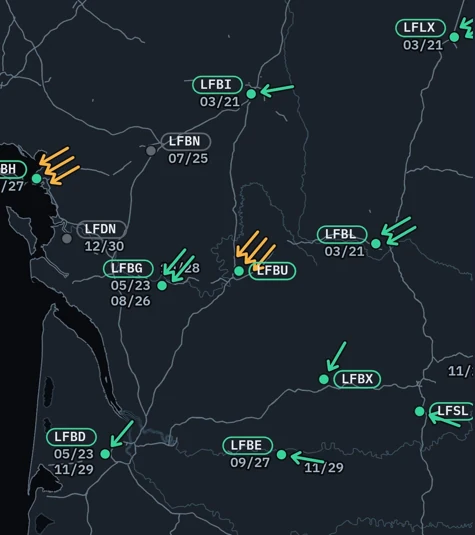
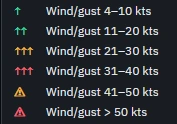
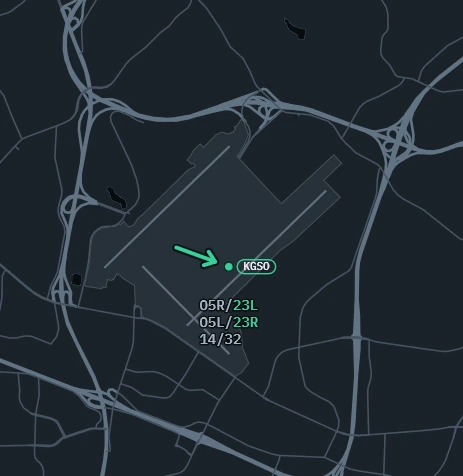
Surface wind on every runway
An arrow at each aerodrome, now and one to three hours ahead. Zoom in and the arrow sits on the runway it favours, so the expected QFU is a glance, not a calculation.
Model turbulence at your level
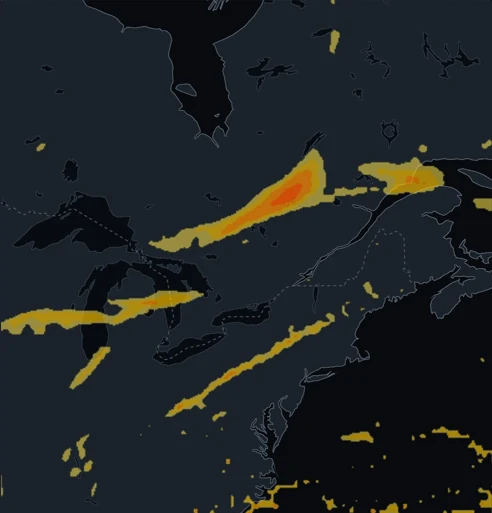
Slide the flight level, step the hour from now to +24 h, keep the SIGMET TURB areas on top. The same data that draws your route profile.
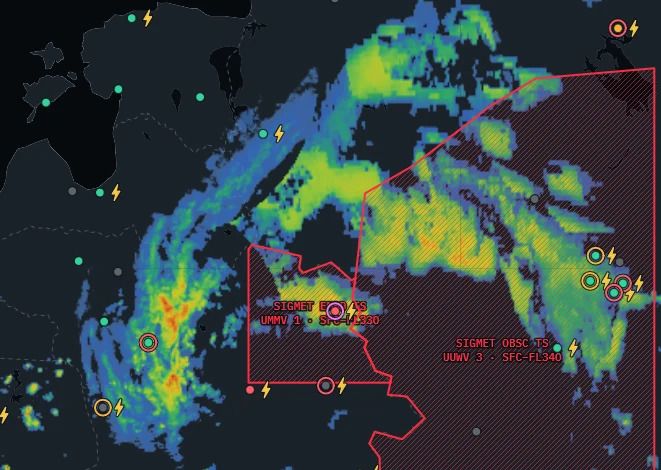
Rain, replayed*
Radar for Europe, North America and Japan, a satellite estimate elsewhere. A 50-minute replay and every SIGMET TS in force, drawn as the polygon it describes.
FIRs, coloured by what is in them
Red when a FIR is closed and cannot be crossed, amber when it is restricted but still crossable, green when it has active NOTAMs and no access restriction. Tap a FIR to read its list, sorted like the aerodrome one.
At a glance, you have an idea of which approach you need.
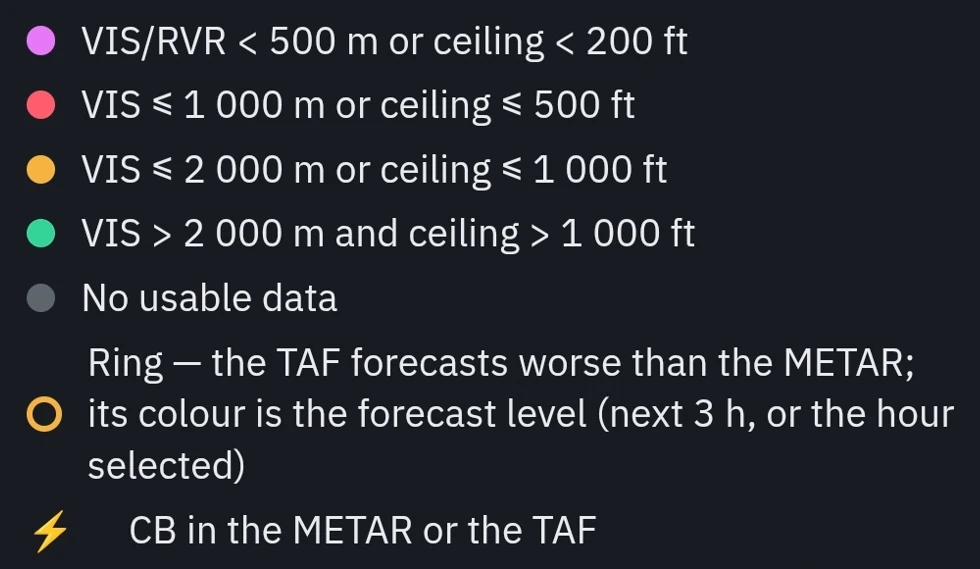
Each colour gives you an idea of the type of approach you will need. For the details, tap an aerodrome to open its METAR and TAF, and compare them with the approaches available.
Amber · Non-precision approach
VIS ≤ 2 000 m or ceiling ≤ 1 000 ft
VOR, NDB, LOC, RNP LNAV: the cloud base still sits above a typical minimum descent height.
Red · Precision approach
VIS ≤ 1 000 m or ceiling ≤ 500 ft
ILS CAT I or LPV, flown down to a 200 ft decision height. Most non-precision approaches stop around here.
Green · Visual approach
VIS > 2 000 m and ceiling > 1 000 ft
The runway can be in sight early: room for a visual approach.
Ring · TAF deterioration
The TAF forecasts worse than the METAR. The dot is the observed level, the ring the forecast level, for the next 3 h or the hour you selected. Here: amber now, red forecast.
Bolt · CB
Cumulonimbus in the METAR or the TAF.
Purple · CAT II / III
VIS/RVR < 500 m or ceiling < 200 ft
Below the CAT I limits (DH 200 ft, RVR 550 m). Only a CAT II or III approach, with runway, aircraft and crew approved.

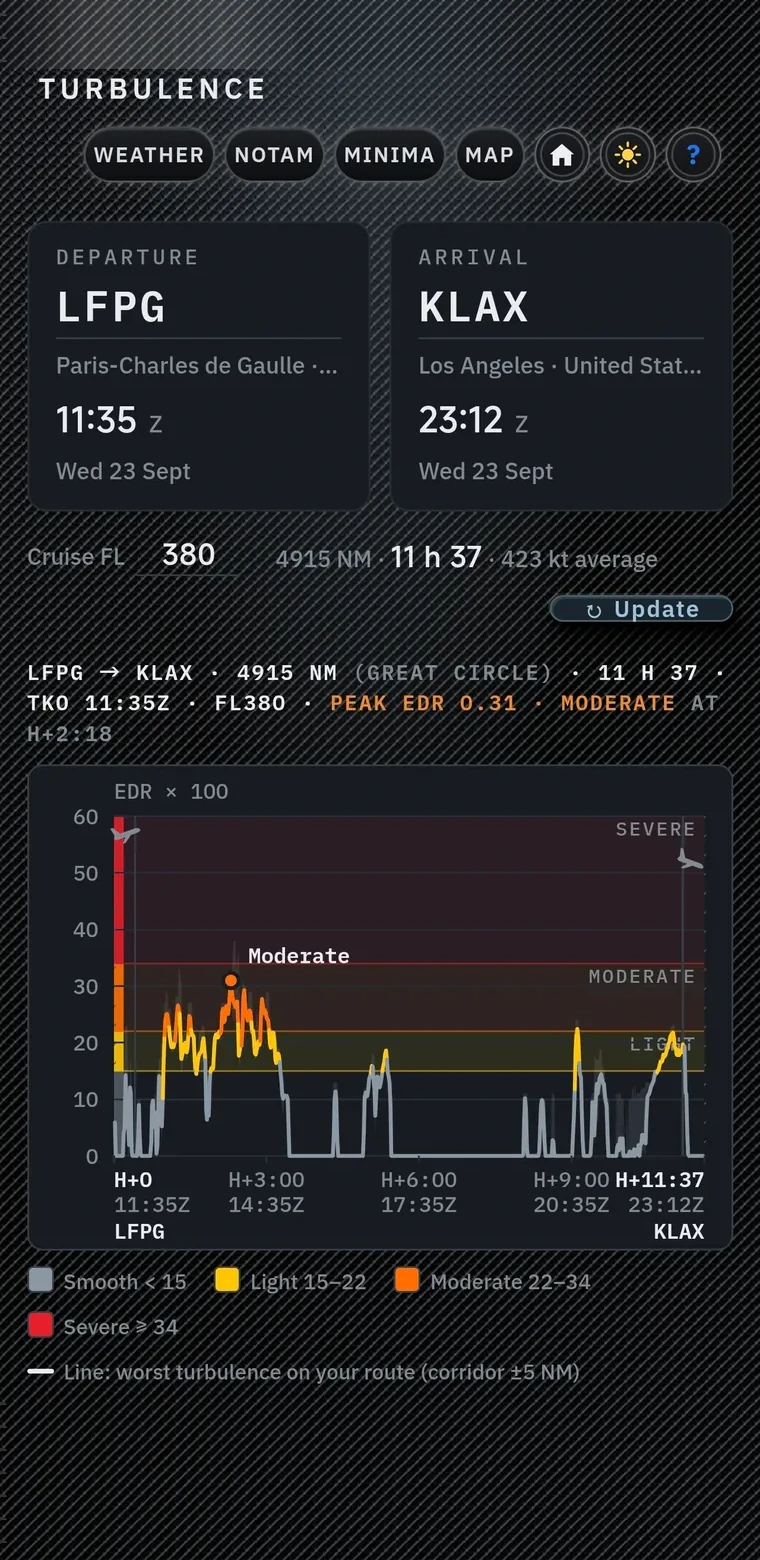
Turbulence along your route, minute by minute.
The profile follows the route in a ±20 NM corridor and follows the clock, so each point is read at the hour you will be there.
The unit pilots use
Smooth below 15, light 15 to 22, moderate 22 to 34, severe from 34. The same scale as the reports you file.
Your cruise level
Change the level and the profile recomputes. The map layer follows the same slider.
Time-aware, not a snapshot
The model hour matches where you will be, not the same hour everywhere along the track.

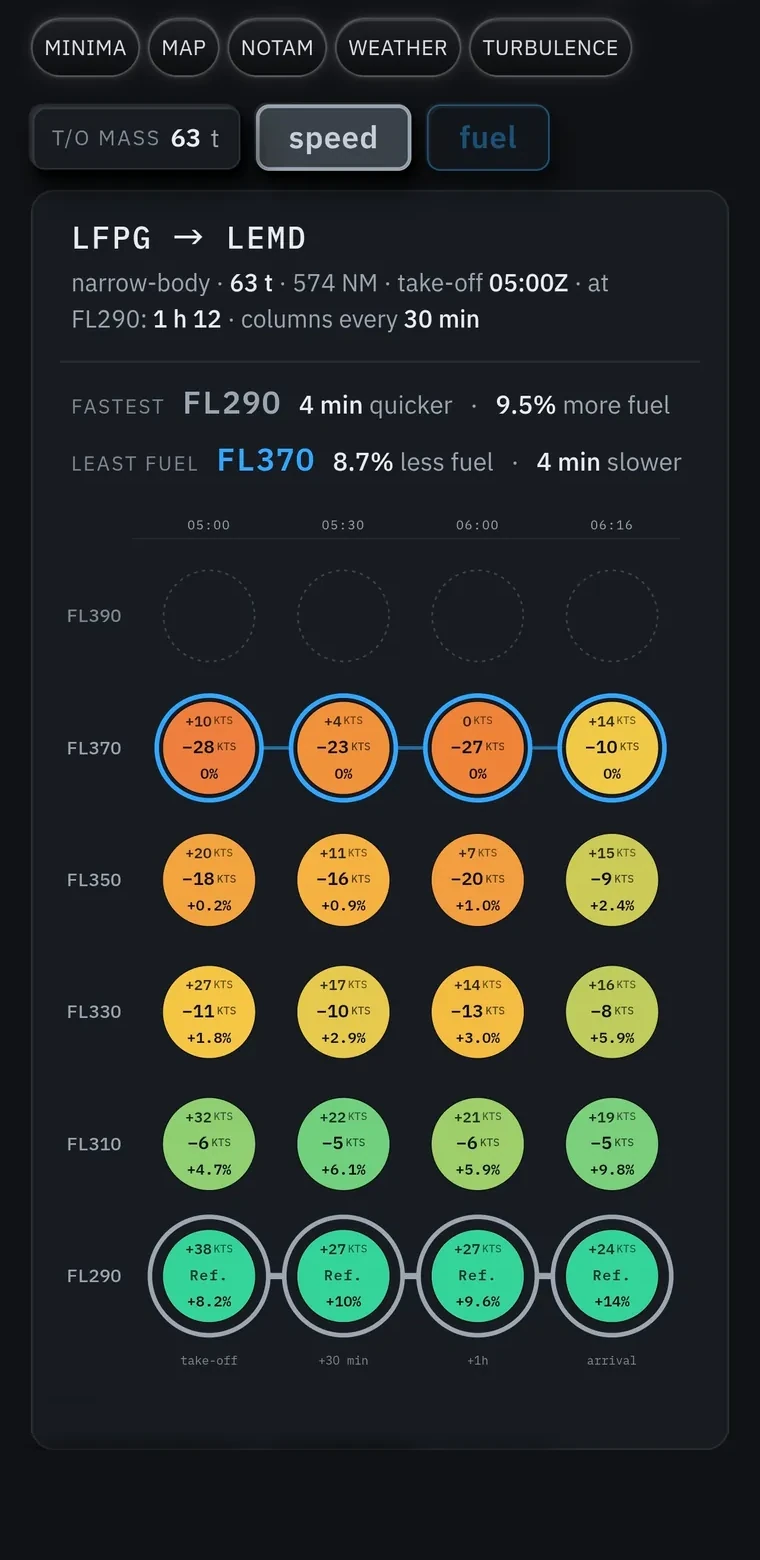
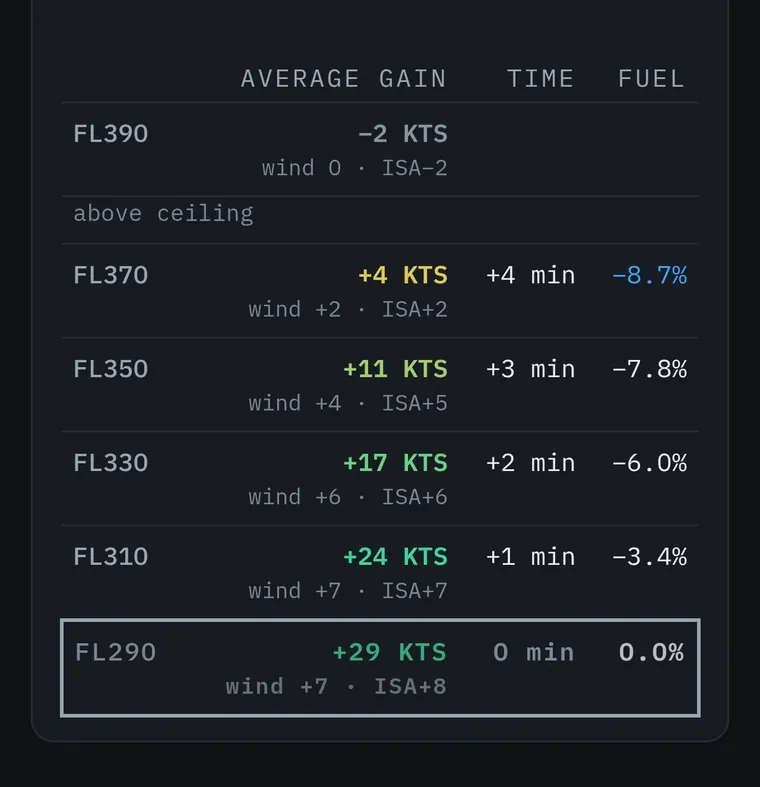
Which level pays: fastest, or least fuel.
LFPG to LEMD, narrow-body, 63 t. FL290 is 4 minutes quicker and burns 9.5% more. FL370 burns 8.7% less and costs 4 minutes. Every level in between, every 30 minutes, with the wind and the ISA deviation behind each number.
Wind and temperature effect by level
The average tailwind or headwind at each level over the leg, and the temperature that changes the consumption.
Time and fuel against a reference
The matrix by column, the summary by row: pick the trade you prefer and see what it costs.
How it is built
For the flight deck, not for the slide deck.
Information only
Every screen says it. Preflight Lens is a second pair of eyes on the briefing, never a substitute for the official one.
Offline, on purpose
The last data fetched stays on the device. In the crew bus, at a gate without signal, the briefing is still there.
UTC everywhere
Zulu on every clock. Local time only where the crew needs it, and labelled as such.
Favourites and routes*
Star an aerodrome, keep a city pair: the next briefing starts in two taps.


Android & iOS
Ready before the gate.
Preflight Lens is on Google Play and the App Store.
Questions, an airline deployment, a runway we got wrong? contact@preflightlens.com